LIDE’s FGI (Functional Genomic Imaging) platform leverages its K-Cell technology and its leading bioinformatics team to deliver next generation transcription analysis. FGI provides two primary benefits:
- RNA-level Transcriptome Analysis:
Classical DNA-based genetic testing is a powerful tool for tumor mutation detection, but there are challenges, especially regarding fusion/rearrangement detection. FGI expression maps are based on RNA-seq data, mapping true expression and minimizing noise inherent in DNA reads.
Example: RNA-seq FGI analysis discovered several PDX models with cMet signal activation (over-expression), but not high-level gene copy number (< 5). Chart below shows one of these PDX models (#LD1-0025-200662), whose antitumor efficacy was verified to be sensitive to cMet inhibitor.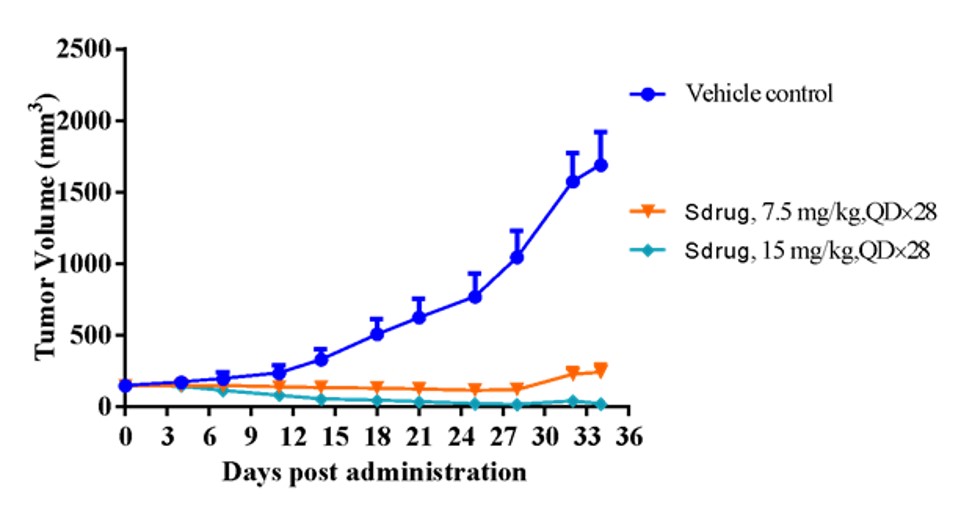
Fig. Tumor volume in response to cMet inhibitor, validating PDX model was sensitive as predicted by FGI analysis.
- Better Visual Identification of Functional Clusters:
FGI cloud maps group expression data into cell types and gene function clusters (subpopulations) based on a systematic biological classification e.g. tumor cells, normal cells, immune system, and vascular system, as well as interferon-stimulated genes, etc. This allows for easier analysis and validation of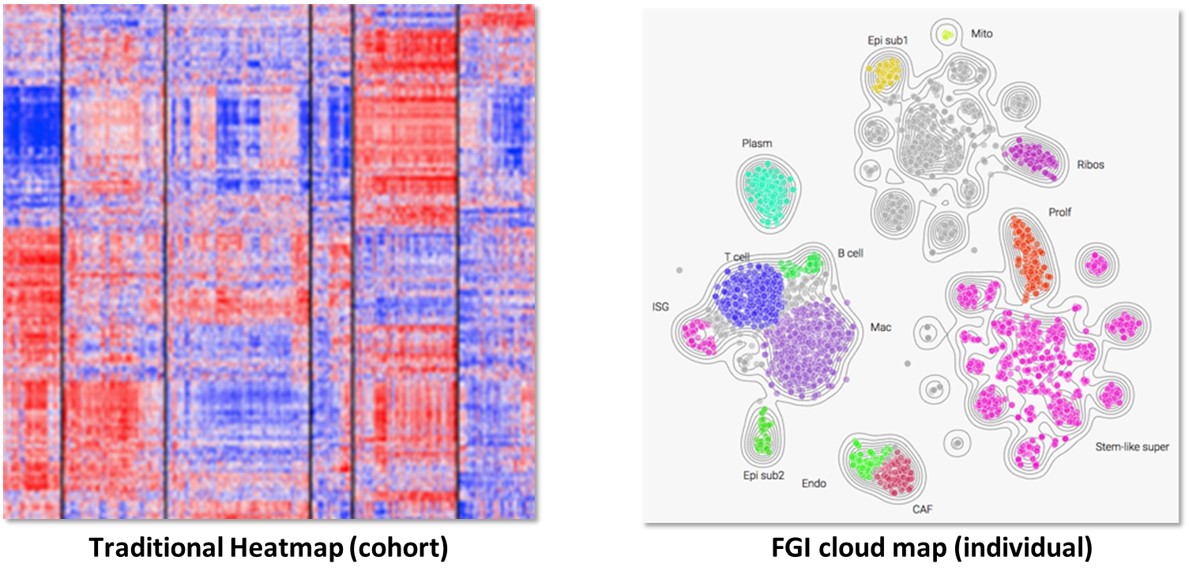
Fig. Traditional heatmaps conveying gene expression can be difficult to interpret vs. FGI cloud maps that group expression data by functional units.
See how FGI was used to identify biomarkers in positive responders here.