Sequencing and Functional Genomic Imaging (FGI)
LIDE’s genomics and transcriptomics workflow provide precision biomarker discovery and mechanism-of-action insights.
- Whole Exome Sequencing (WES) and RNA-Seq: Comprehensive bioinformatics anaylsis to uncover driver and resistance mutations.
- Functional Genomic Imaging (FGI): Clusters gene expression data into biologically meaningful units (e.g., immune signaling, DNA repair, metabolic pathways) with interactive UI for visual exploration of expression signatures
- OncoVee™ K-cell Sequencing (Low Input): Patented platform requiring only ~1,000 cells from biopsies for WES or RNA-seq, overcoming traditional sample input limits.
- Biomarker discovery from MiniPDX® responders vs. non-responders
- Mechanism of resistance studies
- Indication selection and trial enrichment strategies
Examples:
1. Identifying Sensitive Models for Preclinical Studies
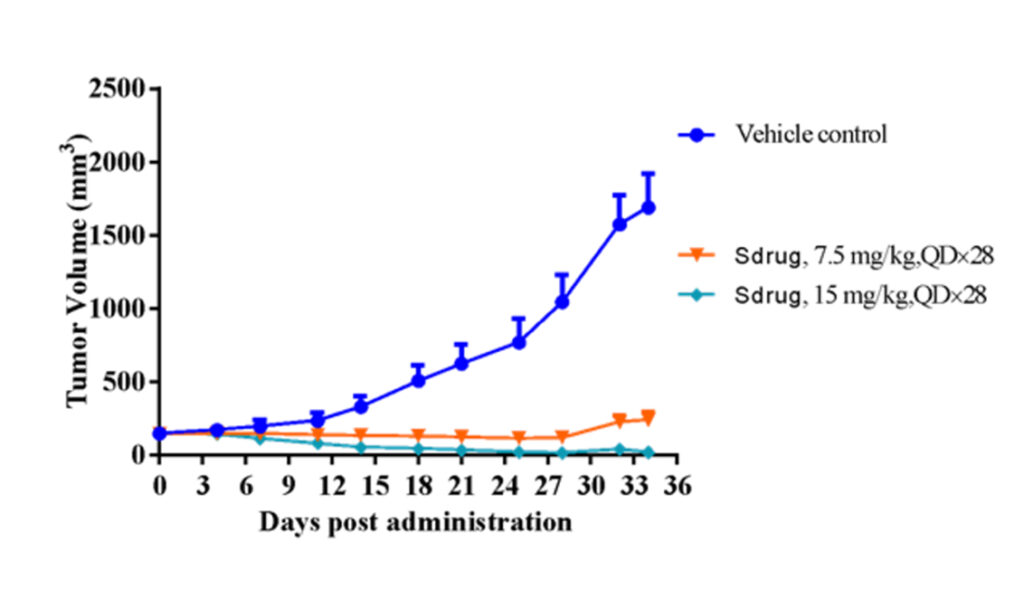
RNA-seq FGI analysis discovered several PDX models with cMet signal activation (over-expression), but not high-level gene copy number (< 5). Chart below shows one of these PDX models (#LD1-0025-200662), whose antitumor efficacy was verified to be sensitive to cMet inhibitor.
2. Better Visual Identification of Functional Clusters
FGI cloud maps group expression data into cell types and gene function clusters (subpopulations) based on a systematic biological classification e.g. tumor cells, normal cells, immune system, and vascular system, as well as interferon-stimulated genes, etc. This allows for easier analysis and validation of expression levels.
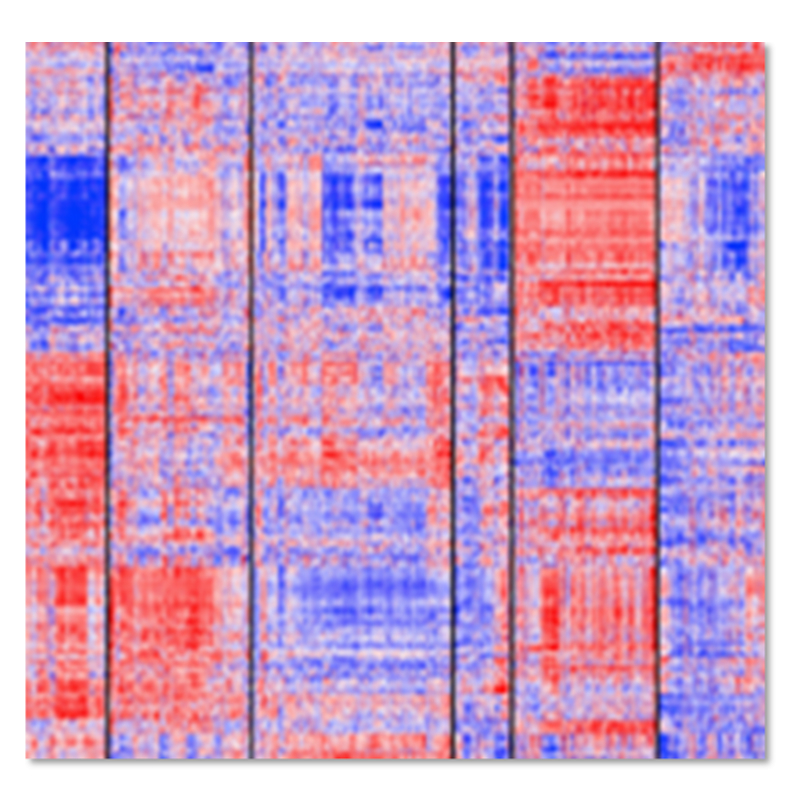
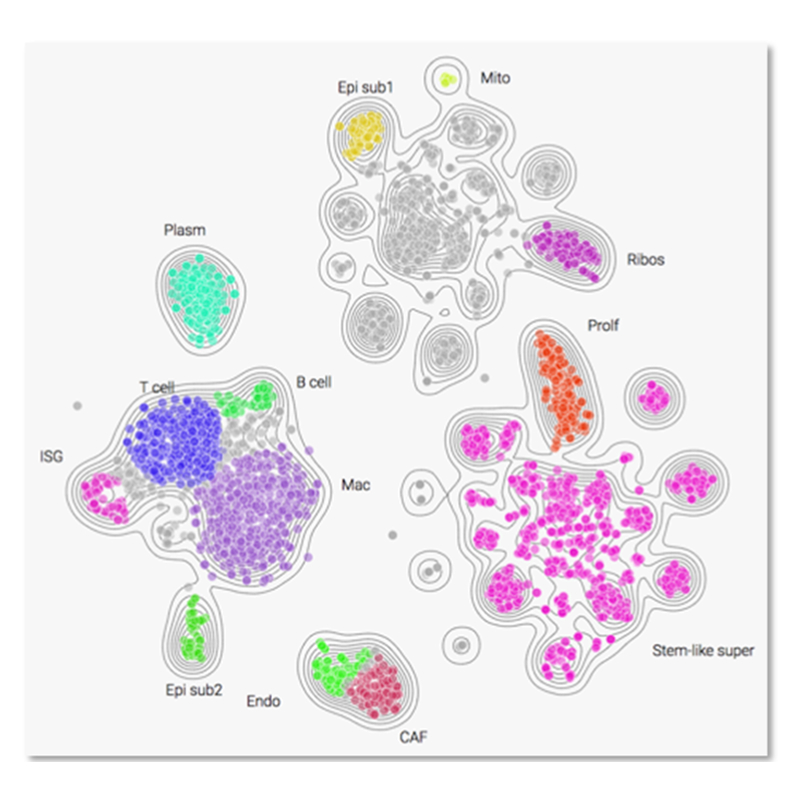
Fig. Traditional heatmaps conveying gene expression can be difficult to interpret vs. FGI cloud maps that group expression data by functional units.