OncoVee™ K-Cell 1000 Cell Kit
Effective transcription level analysis usually requires a large sample of tissue, about a yellow bean size. This requirement eliminates early-stage tumors or biopsy-challenged cases from possibly benefiting from sequencing analysis. LIDE has solved this issue with its OncoVee™ K-cell Kit.
“K” referencing the ~1,000’s of cells needed for transcription, instead of the 10-100’s of thousands of cells usually needed for RNA and DNA sequencing. By only requiring a small sample size, this technology expands the patient base and scenarios that can benefit from genomics, transcriptomics and even proteomics analysis.
Quality scores have been validated and similar to bulk tissue samples.

Validation vs. Larger Bulk Tissue Sample
A valid concern of starting with a small sample size is the quality of the reads. LIDE has validated inputs of 2,000 cells and 5,000 cells against bulk tissue samples, demonstrating K-Cell Kits can offer comparable and stable NGS data quality compared to bulk tissue samples.
| DNAseq | A(Bulk tissues) | B(~2000 Cells) | C(~5000 Cells) |
|---|---|---|---|
| Primary target region size | 36,035,818 | 36,035,818 | 36,035,818 |
| High Quality reads rate | 96.04% | 96.57% | 96.66% |
| Duplication rate | 10.71% | 20.77% | 12.84% |
| Mapping rate | 99.99% | 99.94% | 99.98% |
| Aligned reads | 73,131,449 | 163,320,248 | 261,473,812 |
| Mean insert size | 202.96694 | 172.11678 | 158.913807 |
| Average coverage | 81.332987 | 152.565749 | 255.76497 |
| Fraction region covered >10X* *after adjusted to mean coverage of 90X | 94.47% | 94.12% | 94.19% |
Even with lower input samples, K-Cell Kits can deliver equivalent QC statistics (high quality reads rate, mapping rate and fraction region covered > 10X). Only duplication rate is affected by the ultra-low input, but this can be minimized by increased sequencing depth. Below are results from increasing sequencing depth with replication. Results demonstrate low variability, high-performance of K-Cell technology, and may improve the capture of tumor heterogeneity and increase the discovery of low frequency somatic mutations.
| Sample ID | Mapping rate | Properly paired mapping rate | Mean coverage sequencing depth on official target | Fraction of official target covered with at least 200X |
|---|---|---|---|---|
| T3909799 | 99.84% | 97.08% | 752.33 | 95.58% |
| T3912759 | 99.81% | 96.54% | 750.87 | 93.70% |
| T3116689 | 99.81% | 95.44% | 761.87 | 96.93% |
| T3128859 | 99.80% | 95.61% | 590.19 | 94.64% |
| T3619619 | 99.80% | 95.03% | 751.92 | 95.99% |
| T3324899 | 99.89% | 92.90% | 804.99 | 95.89% |
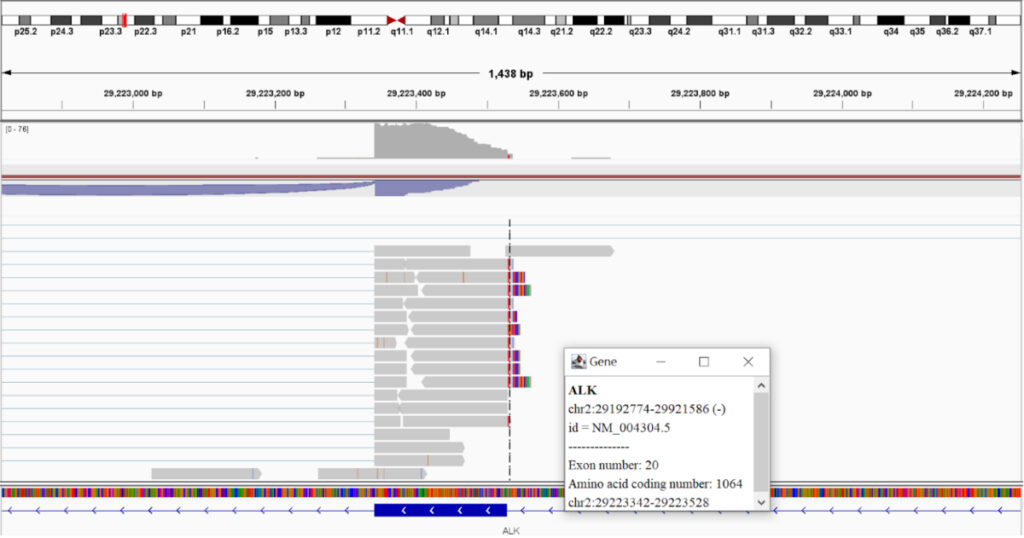
Additionally, K-Cell RNA-seq results also demonstrate high quality reads suitable for subsequent analyses.
| QC Statistics | Test Sample |
|---|---|
| Aligned_reads(%) | 75.08 |
| mRNA_bases(%) | 95.87 |
| Ribosomal_bases(%) | < 0.01 |
| Coding_bases(%) | 58.16 |
| UTR_bases(%) | 37.72 |
| Intronic_bases(%) | 2.24 |
| Intergenic_bases(%) | 1.88 |