Imaging Mass Cytometry & CyTOF: Revolutionizing Single-Cell Proteomics

Imaging Mass Cytometry (IMC) is a relatively new technology and is an evolution of flow cytometry. As part of the Hyperion™ Imaging platform, combined with new CyTOF instrumentation and powerful multiplexed image analysis software, IMC uses metal-tagged antibodies (instead of fluorescence labeling) to enable high-throughput analysis and characterization of the tissue microenvironment. Within the imaging module, a pulsed laser scans and ablates the tissue section in incremental 1 um shots. With each laser shot, vaporised material is carried into the mass cytometer, and the metal ions are analysed by time-of-flight mass spectrometry. This empowers researchers to investigate up to 35 markers simultaneously on a single section of tissue and up to 100 parameters in a single molecule (vs. about 18 max in traditional flow cytometry).


Fig. Representative mass cytometry image of a lung cancer patient’s tissue section showing the overlay of multiple markers. Selected markers are represented by pseudo-colored raw ion images.

IMC is an advanced single-cell proteomics technology and is a powerful tool to evaluate targeted biomarkers in preclinical and clinical samples, aiding in patient classification. 

Learn more about how IMC is used in biomarker identification

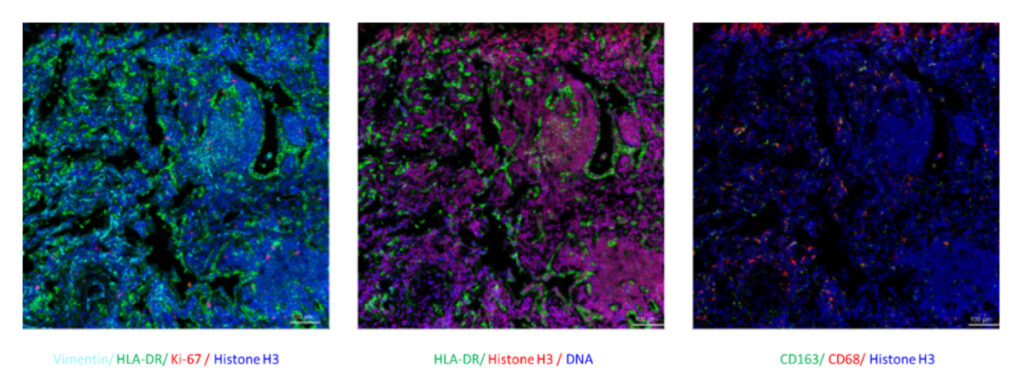
In addition, IMC is performed on FFPE tissue sections, so it can be applied to the retrospective research of disease and drug development using a limited number of pathological sections. LIDE has developed a validated panel of IMC antibodies for leading oncology research targets, ready to use in analysis or customized according to need.

a-SMA LAG3 B7-H3 (CD276) Nkp46
CD20 E-cadherin CD28 β-catenin
CD8 CD11b Collagen Type 1 CD138
HLA-DR CD4 IL-10 CD45RO
PTEN EGFR TGF-B GFAP
B2M MGMT B7-H4 PSMA
CD25 Vimentin CD3 CD14
с-Myc CD123 CTLA-4 CD47
IDO CD45 Ki-67 GzmB
SMAD2 FOXP3 TIM-3 p53
CD34 CD68 beta-Catenin CD163
E-cadherin   Histone H3 PD-L1

Table: Pre-made panels for hot oncology research targets

One of most valuable IMC advancements is that single-cell features can be computationally segmented and clusters of co-expression demarcated to enable downstream investigation of cell subpopulations and microenvironment features.


IMC advancements is that single-cell features

Fig.
(Left) Image scan of cell object. The original data were segregated into single cells and multiple markers were used to identify nuclei and cell membranes. The data was combined and analyzed algorithmically to identify single-cell object masks, containing the cell location and boundary. 
(Middle) t-SNE map displaying single cells from each clustered and heat mapped. Single cells from the large cohort were clustered into groups according to their phenotypic similarity.
(Right) Heatmap showing the z-scored mean marker expression of the panel markers for each cluster. Clusters and markers are grouped according to expression profiles. The resulting 19 clusters were aggregated into larger groups following hierarchical clustering of their mean marker correlations. Multiscale bootstrap resampling was used to assess the uncertainty of each subtree.


More on CyTOF (Cytometry by Time-Of-Flight)
Cytometry by Time-Of-Flight (CyTOF) is a fusion of two experimental platforms: flow cytometry and elemental mass spectrometry. CyTOF uses antibodies that are linked to unique heavy-metal isotopes and the quantity of reporter ions in a particular mass channel becomes a signal with high accuracy for molecular expression with little overlap between parameters. It has become an invaluable tool in single-cell proteomics.


Fig. Mechanisms of flow cytometry and mass cytometry

CyTOF data analysis is similar in form with traditional FACS and thus, very accessible to researchers. Since samples of CyTOF analysis can be preserved for long periods before test after pre-treatment, researchers could collect the samples first and do the staining and CyTOF in the future. It is more convenient method to achieve study plans with a complicated time course and is beneficial to the consistency of staining between batches. 


Fig. Data example of CyTOF. Multiple cell surface markers were combined to define cell types of a rectal cancer sample